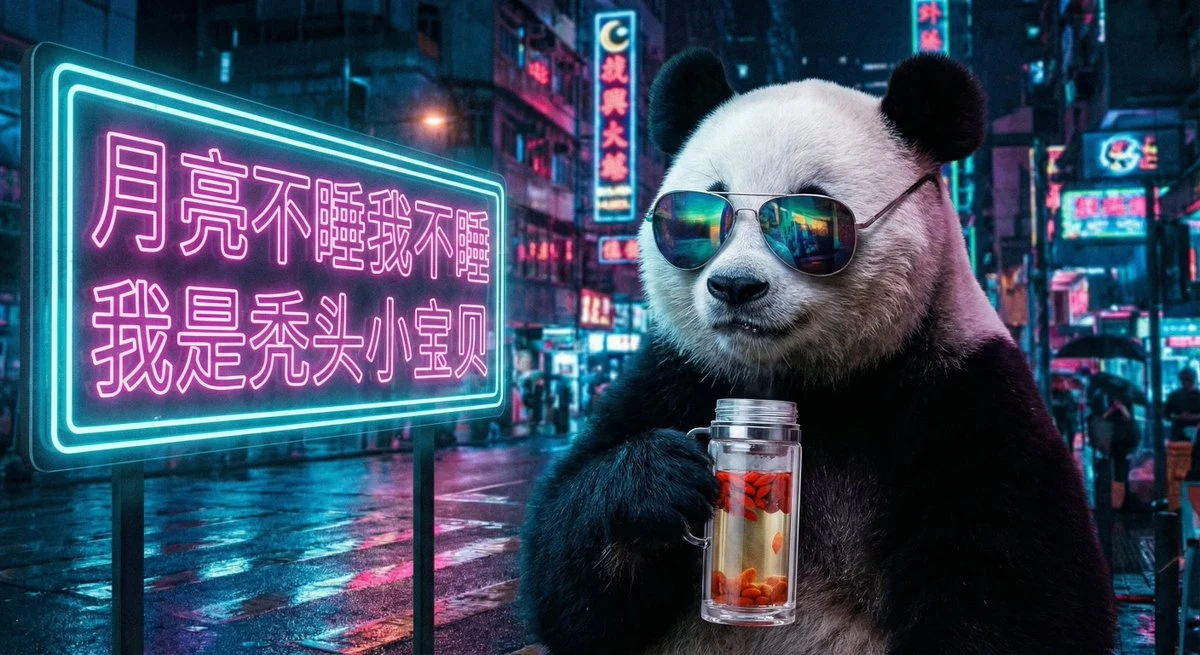
The moon doesn't sleep, so I don't sleep.
Prompt
A panda wearing sunglasses is holding a thermos (with goji berries inside). The background is a neon-lit city at midnight. A neon sign next to the panda reads: "The moon doesn't sleep, I don't sleep either; I'm a bald little dear."
More prompts
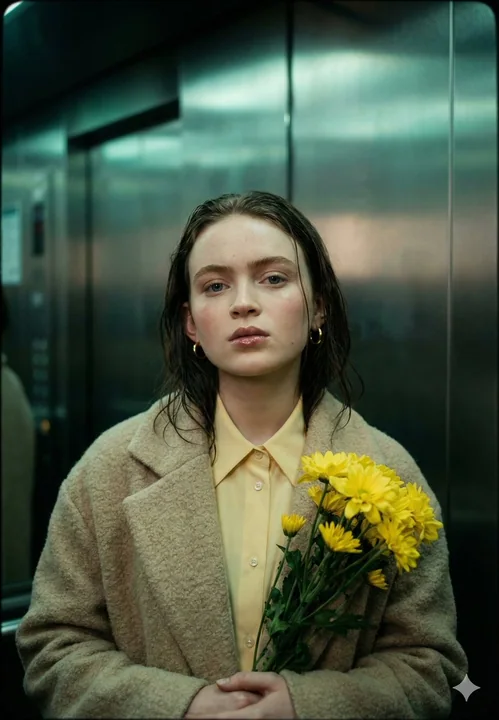
电梯间手持黄花的电影感忧郁少女
{ "subject": "Sadie Sink standing alone inside a modern elevator, holding a small bouquet of yellow flowers at chest level", "mood": "quiet melancholy, restrained emotion, intimate stillness", "setting": { "location": "brushed metal elevato
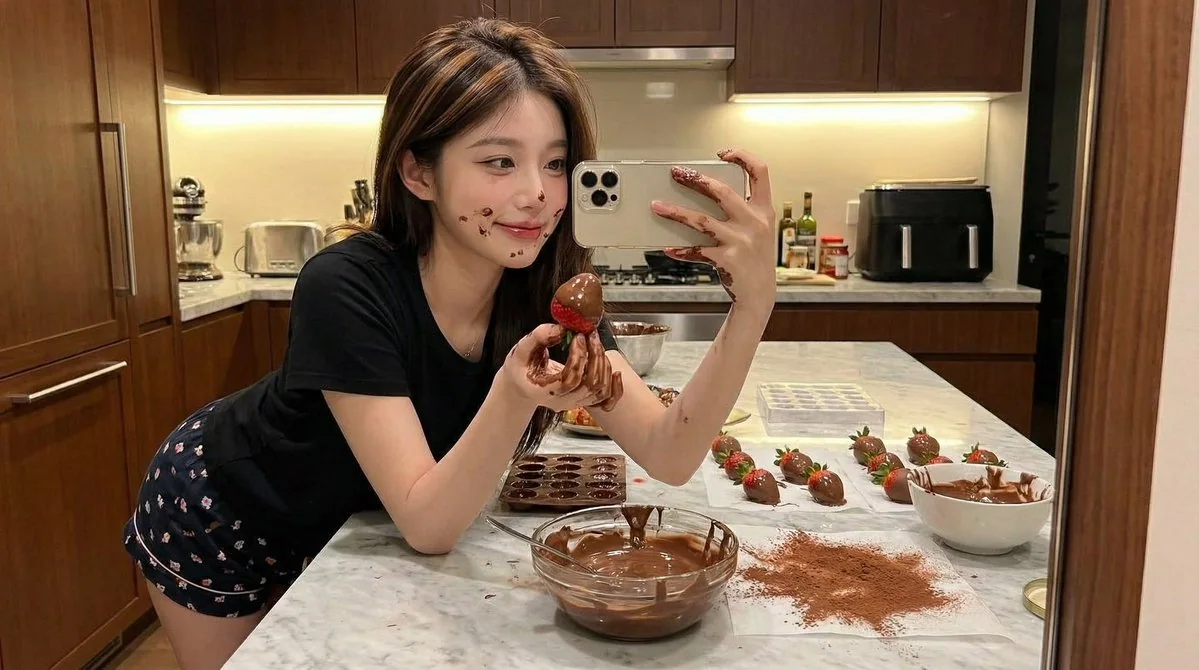
Hyper-realistic kitchen selfie of a playful girl covered in chocolate
{ "Objective": "Create ultra-realistic kitchen selfie of young woman making chocolate", "FaceReference": { "Mode": "Strict face preservation", "Instruction": "Exact facial identity from reference - DO NOT CHANGE FACE", "Consistency": "Face
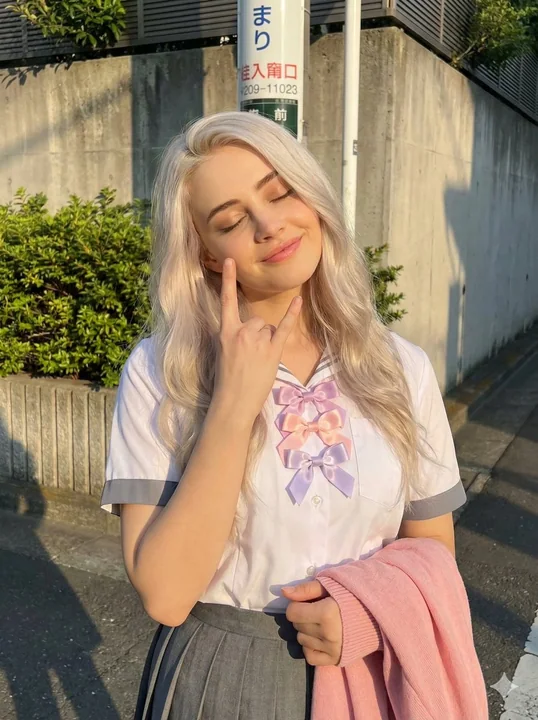
A platinum-blonde girl in a school uniform smiling sweetly with her eyes closed under the warm golden sun
{ "image_generation_prompts": { "natural_language_prompt": "A photorealistic portrait of a young woman with long, wavy platinum blonde hair standing outdoors on a sunny street. She has her eyes closed in a serene expression and is smiling s
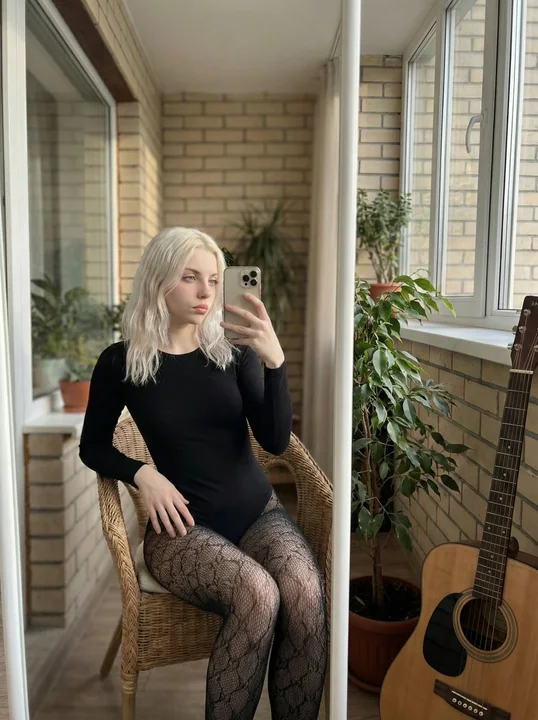
Ultra-realistic fashionable mirror selfie of a girl with icy platinum blonde hair
{ "subject": { "character": "uploaded_photo", "face_consistency": "true", "body_consistency": "true", "gender": "female", "age_appearance": "young adult, early 20s", "ethnicity": "Northern European", "emotion": "composed, neutral, effortles
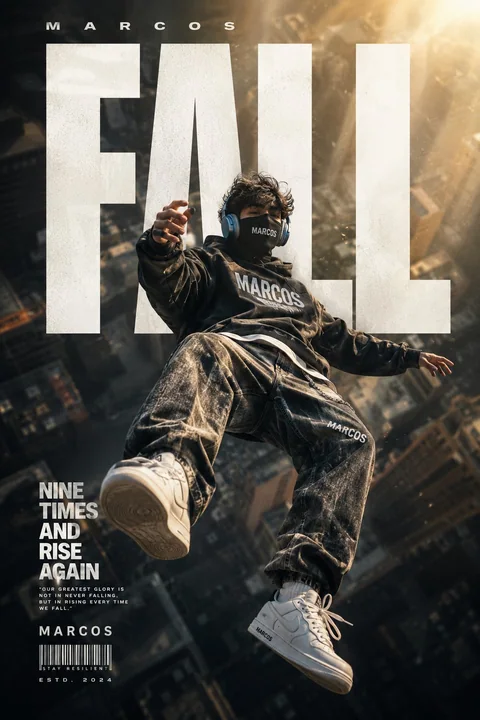
Floating masked young man streetwear cinematic poster
Create a high-end cinematic streetwear poster featuring a masked young man floating in mid-air above a blurred city skyscraper background. The subject wears oversized faded black streetwear, baggy jeans, white sneakers, and blue headphones.
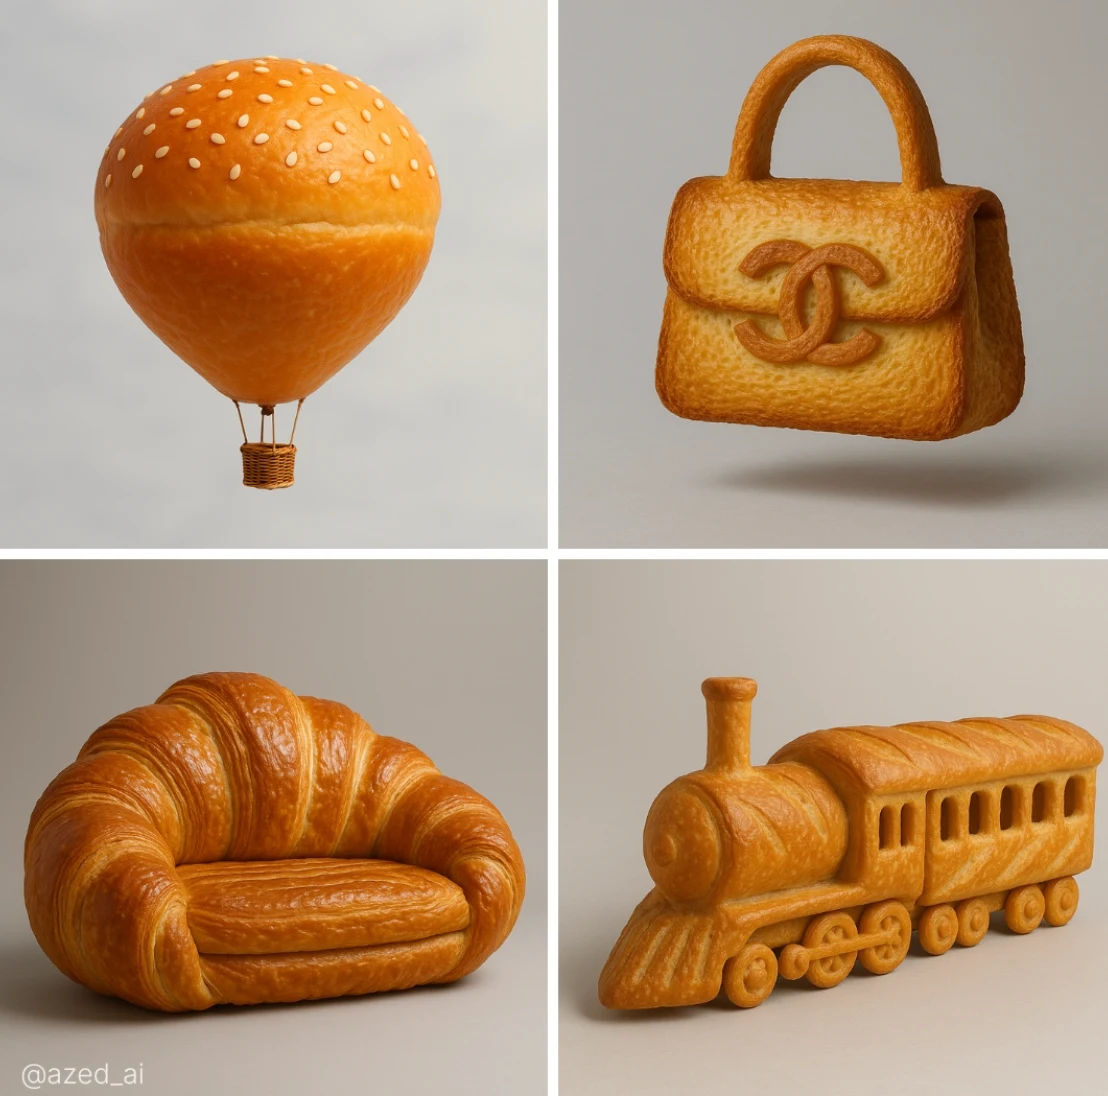
Bread shape
A highly realistic sculpture of a [object], made entirely from [bread type] with ultra-detailed texture and color. The surface shows the natural properties of the bread, golden-brown, glossy, flaky or crusty, with visible layers or seeds wh
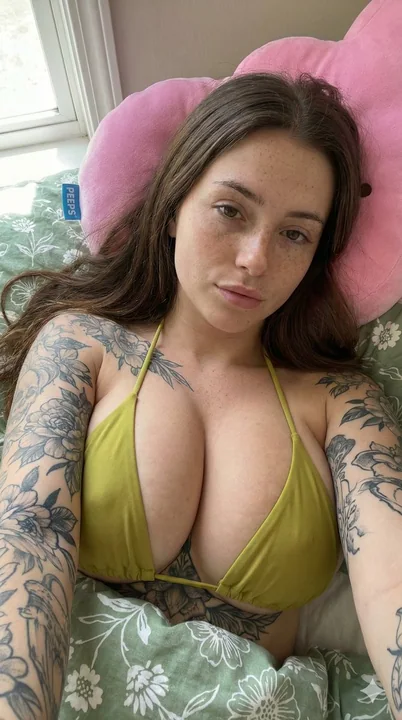
柔光下丰满纹身少女的床上诱惑特写
{ "subject": { "description": "A close-up photograph of the young woman, lying in bed, looking up at the camera.", "body": { "build": "Curvaceous hourglass figure with exceptionally large, prominent breasts (F-cup or larger, extremely full

Golden Abstract Expressionism
{ "base_image": "uploaded image", "style_transfer": { "visual_characteristics": { "head_and_face": { "material": "translucent resin with embedded starlight and glowing neural circuits",
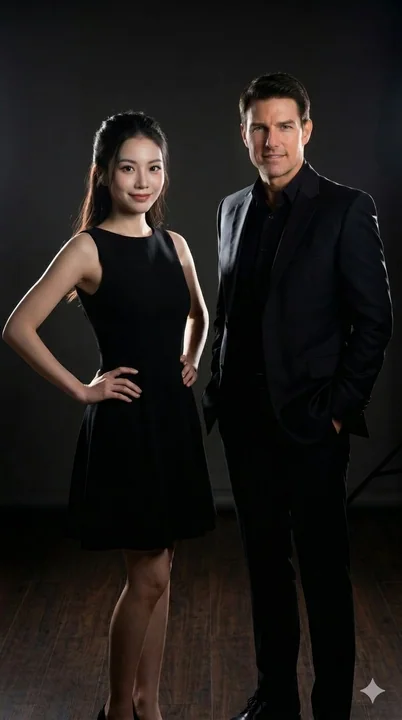
A professional studio portrait of a man and a woman against a minimalist dark background.
A professional studio portrait in vertical orientation with a dark, minimalist background. On the left stands an East Asian woman with long black hair styled in a half-updo, wearing a simple black sleeveless A-line dress. She stands with he